The following blog post is a continuation of Showdown of artificial neural networks and support vector machines where we validated the quality of red wine, with a neural network and support vector machine. This time, we will show what efforts go into making a support vector machine model production ready!

In the previous blog post the support vector machine showed a better prediction and testing accuracy than the neural network. Therefore, we continue with this model and will now show how it can be implemented in a real production setting where we show how a user can test two red wines with our model.
Who is the end-user?
First, let us discuss the quality of our model as it was when we left it in the last blog post. By help of following 11 features our model tries to predict the quality of red wine:
| 0 - fixed acidity | 6 - Total sulfur dioxide |
| 1 - Volatile acidity | 7 - Density |
| 2 - Citric acid | 8 - pH |
| 3 - Residual sugar | 9 - Sulphates |
| 4 - Chlorides | 10 - Alcohol |
| 5 - Free sulfur dioxide |
Through the features available, our model got the following scores:
| Train accuracy | 91.53 % |
| Test accuracy | 90.33 % |
| ROC AUC score | 79.00 % |
When creating a model for production you have to consider who will use this model? Few people have information about a red wines acidity amount, pH-value, density or the amount of chloride. If the model targets end-users, would they use a model that requires this much information before getting a result? **Probably not.**
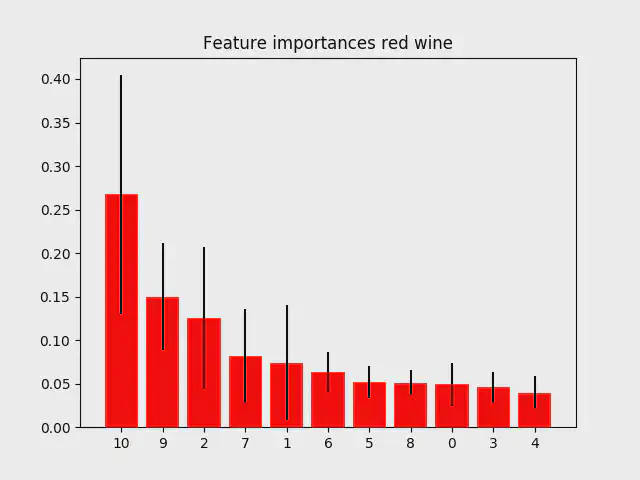
To make a model interaction that is user friendly we can use only the amount of alcohol and perhaps in some cases the amount of residual sugar. Lucky for us, according to the dataset, alcohol (10) seems to be the most important feature in determining the quality of red wine. Residual sugar (3) is of low importance, yet still significant.

Feature importance
Let us test how well a model performs if the only predictor of quality is alcohol:
|
|
Output:
| Train accuracy | 74.34 % |
| Test accuracy | 71.56 % |
| ROC AUC score | 71.34 % |
This is great! By only using alcohol for predicting the quality of red wine, we can predict correctly in almost 3 out of 4 cases. However, the loss between train and test indicates the model might be overfitting. What happens if we use alcohol and residual sugar as predictors?
When using alcohol and residual sugar for predicting the quality of red wine, following accuracy output is obtained:
| Train accuracy | 74.83 % |
| Test accuracy | 74.92 % |
| ROC AUC score | 76.63 % |
The model improved a bit, with an increase in train accuracy of 0.49 percentage points, a test accuracy of 3.36 percentage point, and a AUC score of 5.29 percentage points, indicating the model is more stable, with almost no difference between train and test session, as well as having a model, that discriminates less, visualised by the improved AUC score. We can now save this model, and use it to predict the quality of red wines in production.
|
|
Testing the model
There exist a higher probability, that our model will be discriminating the high quality red wine over the low quality red wine because it is a imbalanced dataset. Before using oversampling, our model had an accuracy score of 98 % in both train and test session, but a ROC AUC score of 50 % visualized by having a model that learned to predict a low quality of the red wine all the time (output = 0).
The red wine that our model is based on origins from a very specific province in Portugal, where the wine created is known as Vinho Verde. The alcohol percentage in Vinho Verde is lower than the alcohol we normally know here in Denmark, and is also supposed to be drinked within the first years of making. If we look at the alcohol percentage in our dataset, it varies from 8.4 - 14.9 % where most of the red wine we find here in stores, has an alcohol percentage of 13 - 16 %. It is therefore not expected that the given model works on other types of red wine, than Vinho Verde, making it generalizable only to the most common red wines here in Denmark. However, let us test our model on two Vinho Verde red wines we have found:
The Vinho Verde red wine Terra Verde, Lot Series Pinot Noir, 2017 has scored 88 out of 100. It has an alcohol percentage of 13.5 and contains 0.2 g residual sugar. It is expected that our model gives mentioned red wine a score of 1 (high quality)
|
|
Output: [ 1 ]
Another vinho verde red wine Casa da Tojeira MFS red, 2017 contains 9.5 % alcohol and 1.8 g of residual sugar. There exist no rating on this red wine, however due to the low alcohol percentage we expect to get an output equal 0.
|
|
Output: [ 0 ]
Success!
We have created a stable model by only having two input features: (1) Alcohol and (2) Amount of Residual Sugar in hope of making the model user-friendly for the end-user. By only using alcohol as a predictor for the quality of red wine, we got an unstable model, and chose to add residual sugar providing a stable model we can use in production settings. Our prototype can not only detect correctly in 3 out of 4 times, it also do not discriminate or overfit!
We can see that our model rates similar as wine experts, which makes sense as the dataset is provided by five wine experts. However, as the objective of this model is to determine the quality of red wine, we must remember that people taste things differently thanks to our taste buds. The model is therefore not helping you find the wine you like, but through some physiochemical properties in red wine determining whether the quality of the given wine is high or low.
Our model is stable, do only ask the user for two input values in order to create an output, yet only the amount of alcohol is given on the bottle of the red wine. Further investigation is needed to find the amount of residual sugar, and most of the time it is actually impossible for consumers to find.
For this given case, the generalization to other red wines than Vinho Verde might be limited due to the low alcohol percentage and limited or no aging before serving.
Closing remarks
This dataset is interesting because it provides you with lot of thought about data validation, model selection, generalization, and usability.
We have dealt with outlier detection, missing values in predicted variables, and correlation tests. We have investigated two machine learning algorithms and determined the best result, and have now discussed the generalization and usability of the model created. When dealing with machine learning problems, the first step is always to understand and define the given problem to be solved (defined as an output), and then determine what data might be relevant for solving this (defined as input or features).
Nonetheless, it is at least as important to understand who the end-users are, and what information they have available as well as how much time they will spend on searching for this information.
To put the model we have created into production there are more considerations to make around how to serve the model for inference and how to create observability of the model to see that it actually responds to user requests. Next it is beneficial to consider if the data users send to the model should be saved to extend the current data set and later used in re-trainings of the model to improve it.
// Maria Hvid, Machine Learning Engineer @ neurospace