We are often asked to explain the difference between Condition-Based Maintenance and Predictive Maintenance. This blog post will give you a comprehensive understanding of the similarities and differences between Condition-Based Maintenance and Predictive Maintenance.
The blog post is divided into two parts. The first part is for busy people and is a fast version of the comparison of the two maintenance approaches. The nerdy details is in the second part for those of you who want to be maintenance approach experts! PS Part II contains real life comparisons of the two approaches.
Part I - the fast run down
The first thing you may notice is that the words condition-based and predictive is not very similar. This actually highlight one of the key differences for the two approaches. Condition-based maintenance uses conditions or thresholds to say when it is time to perform maintenance. It is like you setting a rule, e.g. “When this sound starts we need to do maintenance”. Predictive maintenance on the other hand tries to predict into the future when you will need to service your equipment.
Similarities
Both condition-based maintenance and predictive maintenance rely on data from your machines. The data is used to say something about the condition of your machine, and whether it is time to perform maintenance. Now, this is as far as it goes to how condition based - and predictive maintenance are alike. The approach that is used to determine the condition of the machines differ significantly.
Differences
Condition-Based Maintenance can be defined as equipment maintenance performed when certain indications implies performance degradation. This is often defined as the process being out of control or in chaos. It is different how the performance level is tested in condition-based maintenance as it is an umbrella term and are sometimes misused. The table below lists three different types used identifying performance degradation with condition-based maintenance:
| # | Type | Description |
|---|---|---|
| 1 | Use your senses | Look for smoke, and listen to the sound of the machine |
| 2 | Sporadic measurements | Take sporadic measurement on the equipment and compare to previous measurements |
| 3 | Vibration analysis | E.g. by using Control Charts |
Now the first two approaches are straightforward in how they work. But first let us take a moment to talk about vibration analysis and control charts. This is the approach that is most similar to predictive maintenance as they use the same type and frequency of data. By using control charts on vibration data from your equipment, you can get an indication of when your machine starts to behave differently. When values are observed outside of the upper and lower control limit it is said that your process is statistically out of control at this point in time. This is highlighted in the illustration below, values within the green area will be considered normal and those above or under the limits will be considered abnormal.

It is up to you to decide when new control limits should be implemented.
If you are interested in how you calculate these control limits, continue reading part II of this blog post.
Predictive Maintenance relies on advanced statistical methods, such as machine learning, to dynamically define when a machine is okay or need to be maintained. It looks at patterns across all sensors and makes one multivariate prediction model. The more data sources and data available the better are the predictions. For this reason, predictive maintenance models do only get better at predicting future breakdowns over time.
Predictive maintenance can find complex indications for breakdowns which will be nearly impossible for humans to spot. We have results of predicting future breakdowns spanning from minutes to hours depending on the quality of the data and the frequency data is available (once an hour or once every 250 ms). But in some production settings where every breakdown can amount to millions in waste or produce security risks even 5 minutes can be crucial.

As it can be seen in the illustration predictive maintenance gives the possibility of detecting even the smallest changes in behavior. Like in the previous illustration everything in the green area is considered okay and everything outside it is not.
Summing up
We have tried to summarize the similarities and differences of condition-based maintenance and predictive maintenance in the table below for a quick overview:
| Condition-Based Maintenance | Predictive Maintenance |
|---|---|
| Some types relies on data | Relies on data |
| Human defines decision-rule | Data defines decision-rule |
| Static decision rule | Dynamic decision rule |
| Tells if something is wrong here and now | Predicts failures in the future |
| Can lead to excessive maintenance | Can be used for just-in-time maintenance |
| Sensitive to noise | Less sensitive to noise |
| Preventive approach | Predictive approach |
This concludes part I. Now, if you are interested in getting a bit nerdy with the details and want to know how we came to the conclusions of the similarities and differences you should read on. It includes an example on condition-based maintenance using control charts on the water pump dataset, grab a cup of coffee and continue reading.
Part II - Condition-Based Maintenance - an example
As described in Part I condition-based maintenance comes in different types from using your human senses to collecting data and analyzing it. Type 3 of condition-based maintenance uses data collection and often relies on Control Charts [1],[2]. If you have ever done any process and quality control using Six Sigma you will be familiar with the concept. Control Charts are used to monitor quality by identifying variation in a process or in the quality of a product, and is calculated by having simple statistical measurements: the sample mean (x̄), and standard deviation (s).
The theory is, that your process is in control, when data from your machine do not exceed mean +- 3 standard deviation. This origins from the statistics of when data is normally distributed, +-3 standard deviations from the mean, will cover 99.72% off all the data.

The mean is the center of your control chart, and based on the mean and standard deviation can you calculate the upper control limit, and lower control limit.
Upper Control Limit: is the maximum value you are allowed to see, before your process is defined as being out of control. It is calculated as the mean plus three standard deviations.
Lower Control Limit: is the minimum value you are allowed to see, before your process is defined as being out of control. It is calculated as the mean minus three standard deviations.
When mentioning Control Limits in the following, we are referring to the space between the upper and lower control limits. All values observed outside of the upper and lower control limit, are said to indicate that the process is out of control, and will send you a warning. You can get insight on when something is starting to look different, and take action on it. But how does it work on a real-world problem?
Introduction to the dataset
The Predicting Machinery Breakdown on a Water Pump Part 1 and Part 2 we used a dataset containing data from 52 different sensors.
When using predictive maintenance on this dataset, we are able to detect all the breakdowns on the water pumps 7-61 minutes prior to them occurring. We had a very confident prediction model, and had only a few type I (false positive) and type II (false negative) errors. If you are interested in knowing more about predictive maintenance you should read predicting water pump failure with predictive maintenance.
Lets see if condition-based maintenance using control charts can give better results.
Control Chart on a Water Pump
For testing condition-based maintenance via control charts we will use the same water pump dataset as we used for predictive maintenance as this gives us the opportunity to compare the two approaches. We know that the data has a somewhat stable pattern with a few outliers when the water pump runs normally (see below). This should make it easy for a control chart to spot!
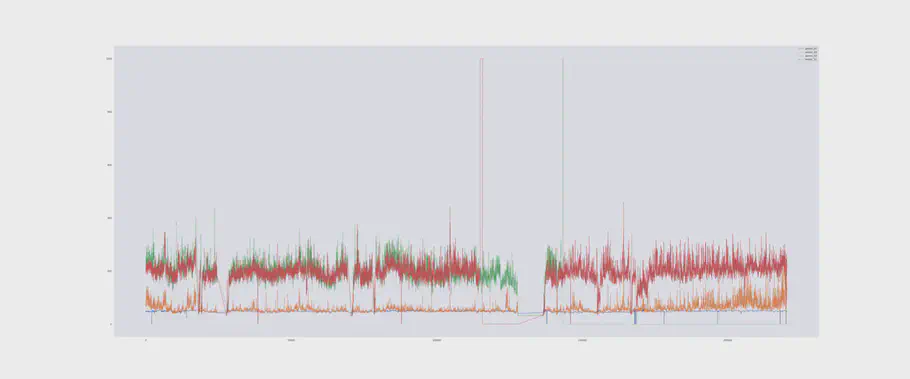
We split the data into intervals that always start after a recovering stage, and ends with a failure:
| # | Description |
|---|---|
| Interval I | 0 to first breakdown |
| Interval II | After Recovering from first breakdown to second breakdown |
| Interval III | After Recovering from second breakdown to third breakdown |
| Interval IIII | After Recovering from third breakdown to fourth breakdown |
We additionally only perform this test on sensor 47, which has shown to have a high feature importance for the outcome. If you want to implement this in production, you would have to do the following for all 51 sensors or look in to creating a multivariate control chart.
Using Interval I to detect breakdown in Interval II
We use the data measured before the first breakdown (Interval I) to set the upper and lower control limit for predicting the second breakdown (Interval II). We can not use Interval II to predict the second breakdown, because this data would not be available when creating the control chart in a real world scenario. If we would do this it would introduce data leakage.
The sample of Interval I has a mean of 40.99 and a standard deviation of 4.56 giving a lower control limit of 27.31 and an upper control limit of 54.66.
The graph below spans from the 13th of April 2018 at 13:40:00 o’clock to the breakdown the 18th of April 2018 at 03:18:00 o’clock (Interval II).
As visualized we would estimate the process is out of control the 13th or 14th of July, shortly after having solved the first breakdown. Now, even if we would create a new control chart right after the clear outliers in the beginning of the graph, we would still have 4-5 false warnings between the 13th and 14th of July.
In other words this is noisy and can lead to excessive maintenance or “The Boy who Cried Wolf”.
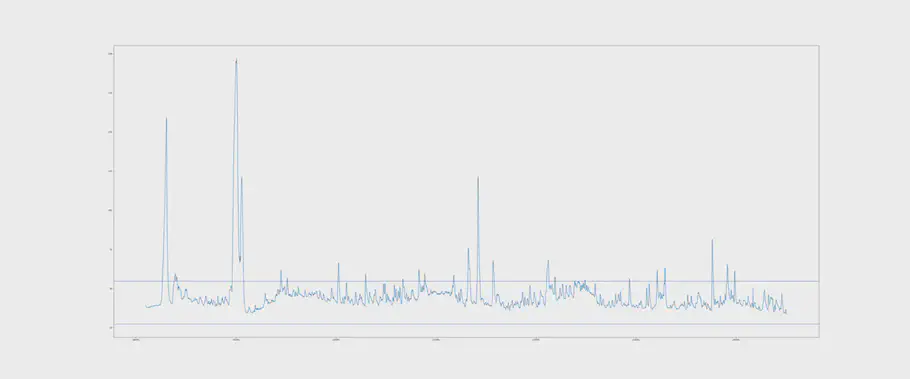
When using the previous interval (Interval I) to make the upper and lower control limits used on Interval II, we get 442 observations that are observed outside of the control limits! Interesting, none of them are at the initial breakdown and is therefore noise. For comparison, if we introduced data leakage, and used data from Interval II to set the Upper and Lower Control limit, we would still get 119 observations outside of the control limits for sensor 47 - again not close to the breakdown. This is illustrated in the following graph:
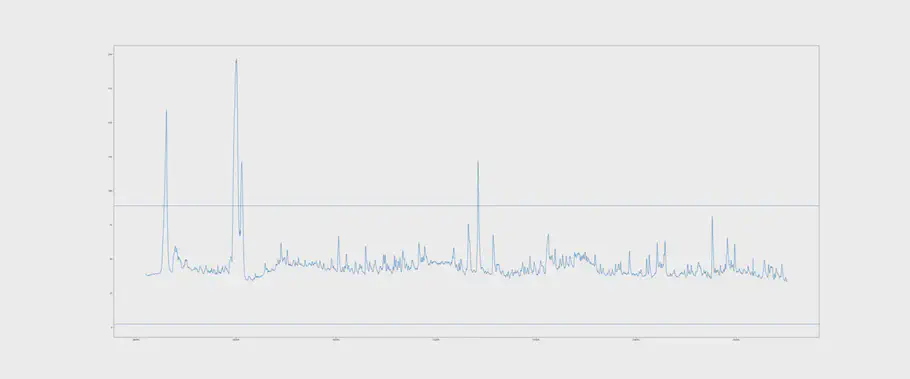
As a comparison if we continue the data leakage and add sensor 48, 49, and 50 to our control chart system, we will get 355 observations that would be classified as outliers when using data from Interval II for setting the control limits. If we remove the data leakage and use Interval I for setting the control limits we get 2,152 observations! In the real world, where data leakage can not exist, this would amount to being pinged or called 2,152 times which would indicate that the machine is broken even though it is not.
Using Interval II to detect breakdown in Interval III
For the third breakdown which occurs in Interval III, we use the data from Interval II to calculate the control limits. We get a mean of 45.72 and a standard deviation of 14.46. We thereby get a lower control limit of 2.35 and an upper control limit of 89.09. The third breakdown occurs on the 19th of May 2018 at 03:18:00 o’clock providing a span from the 13th of April 2018 at 13:40:00 o’clock until the breakdown the 19th, and is visualized in the graph below:
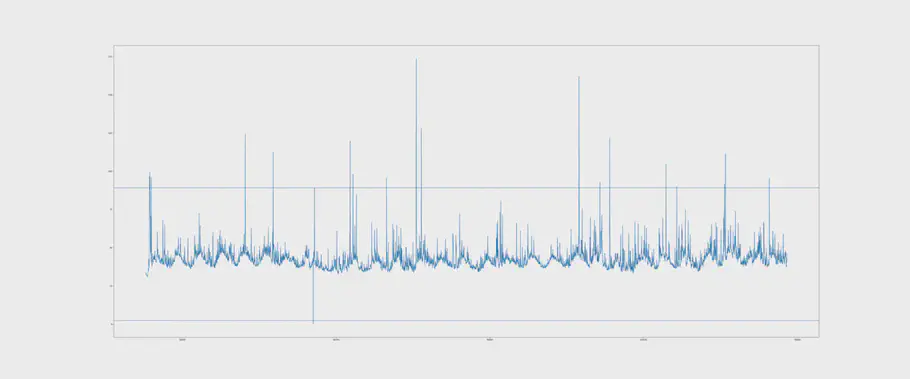
We get several warnings of the water pump not being in control. The warnings starts from the very beginning of this interval, meaning right after the water pump was maintained. It also illustrates that control charts are sensitive to noise in the data - just a little change in how your machine behaves will give you a warning. A change in vibration from a change to a new bearing can create this noise but it do not necessarily indicate that machine is out of control nor that you should perform maintenance. If you did, you would do excessive maintenance and be throwing out a perfectly good bearing.
Testing Dynamic Control Charts
The previous sections have been using static control charts. It is however possible to using what is called dynamic control charts where the values for the upper and lower control limit are recalculate continuously. This is done by implementing a moving average and moving standard deviation. The graphs below shows the dynamic control chart for Interval I and Interval II.
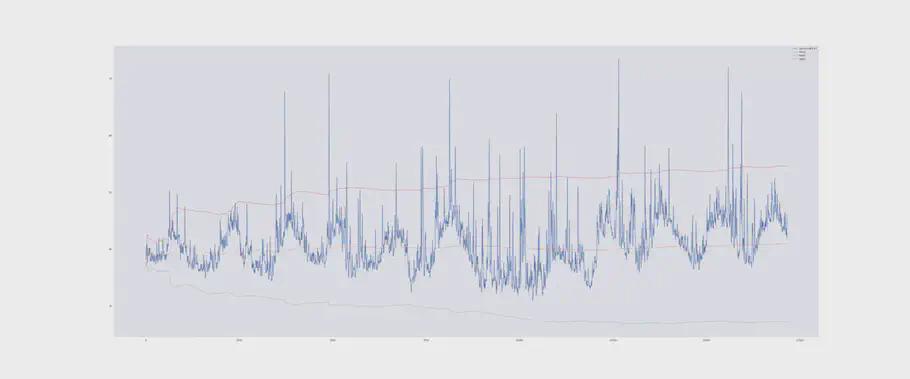
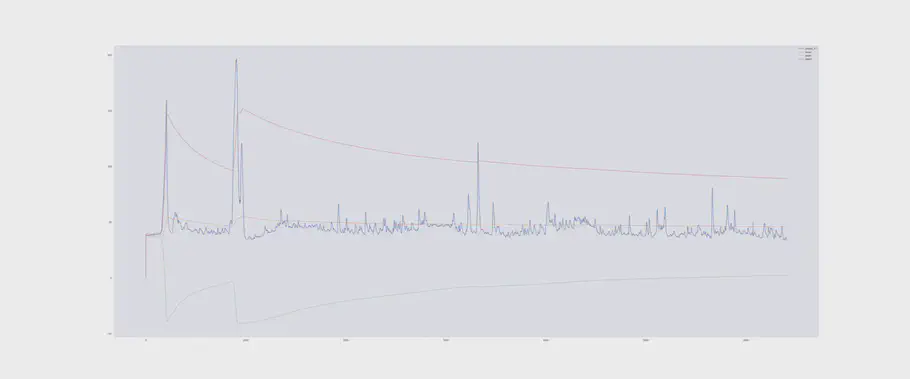
The upper and lower control limits are sensitive to the outliers observed, providing a wide control limit in Interval II. It is important to remember, that any changes and abnormality happening within the control limit is wrongly considered as normal data when using control charts.
The control charts might be improved by using the trimmed mean and calculate the standard deviation from it. The trimmed mean leaves out the 10% lowest, and 10% highest values, leaving out the most extreme values.
Some people suggest to calculate the mean of an interval, and plot this value in to the control chart as an observation. We do not recommend this method, as you might miss important information by only having the mean e.g. you only have the aggregated data and not the raw data.
Others have used multivariate variables to calculate the control limits, that will improve the model as well.
Disclaimer: As mentioned in the beginning of this blog post, there do exist a variety of different methods to perform condition-based maintenance, and those mentioned here, are only a few.
Conclusion
This blog post have compared condition-based maintenance and predictive maintenance.
When using the control chart approach, we will observe a problem before the breakdown in all cases.
However, what we have found it that we get a “The Boy who Cried Wolf” scenario of which our system gives several warnings of breakdowns at times no breakdown occurs (false positives).
As shown in the graph below, there is a natural change in equipment vibration over time.
When using control charts, these natural changes will give you a warning, because the data starts looking different, and you will be alarmed of a process being out of control.
This is why we believe the control chart to be very sensitive to noise in the data.
Now if you replace the bearing, or repair on the water pump every time you see a change in the data, you might not use the entire life-cycle of equipment, and spend too much money on maintenance.
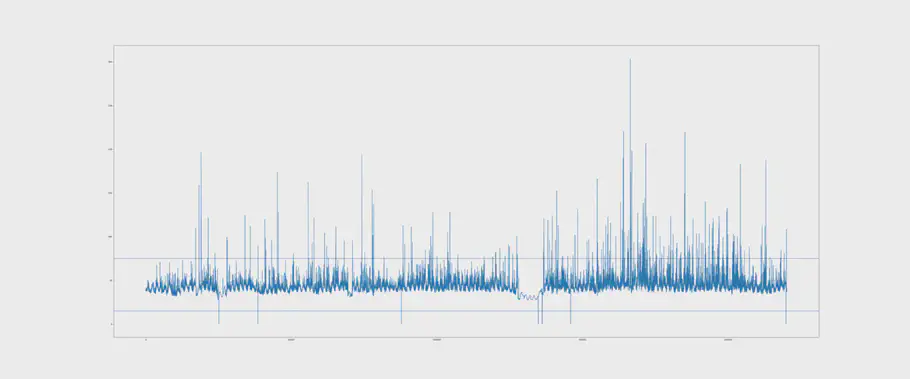
However, it is a pattern of a longer series we are interested in, if we are going to say something about the state of the equipment. Condition-based maintenance via control charts can only say something about the observations that falls outside the control limits, whereas predictive maintenance using machine learning can find significant changes within the control limits as well. This is the biggest difference between condition-based maintenance and predictive maintenance.
Besides performing excessive maintenance due to noise when using condition-based maintenance compared to predictive maintenance, we additionally have to monitor the upper and lower control limits.
This involves a person using significant time on making the solution work.
One approach might be to use dynamic control charts, trimmed mean and so on.
However, this might be possible to automate to some level, but still demands you to have an overview of all the control charts that might give you an alarm at different times.
In condition-based maintenance via control charts it is up to you to define these control limits and defining decision rules for when you take actions, e.g. if two observations in a row are observed outside of the control limits what do you do?
In predictive maintenance, these control limits are defined automatically, and with retraining of the model they automatically change over time.
The more data you use for training a predictive maintenance model the better the model you will get.
This is the second way the two approaches significantly differs from one another.
You can get started with both predictive maintenance and condition-based maintenance within a very short implementation period and start with zero data.
You might think it is easier to get started with a control chart than using machine learning, however that is not necessarily the case.
Both control charts and machine learning requires time to prepare and clean the data, analyze the data, find the best methods and so on.
In condition-based maintenance, this will be to test which control chart, trimmed mean, dynamic models etc. gives the best results, as well as testing in production if the method gives you too many alarms.
In predictive maintenance, we use hyperparameter tuning for generating the best prediction model possible, as well as validating the model.
All this will be done before the model is put into production to ensure the best result.
Finally, predictive maintenance predicts future breakdowns by giving you a probability, whereas condition-based maintenance prevents additional breakdown cost by telling you something is wrong now. This is the third way the two approaches significantly differs from one another.
// Maria Hvid, Machine Learning Engineer @ neurospace
References
[1] Rasay, Fallahnezhad & Zaremehrejerdi (2017) Application of Multivariate Control Charts for Condition Based Maintenance. International Journal of Engineering (597-604) Vol 31 (4)
[2] Liu, Jiang, and Zhang (2017) An integrated model of statistical process control and condition-based maitnenance for deteriorating systems. Springer