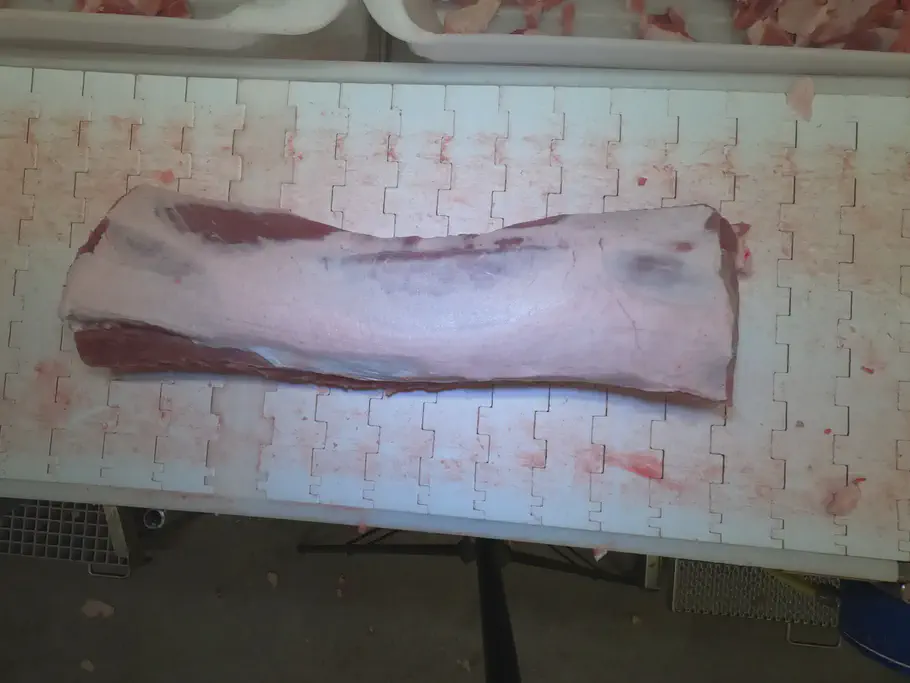
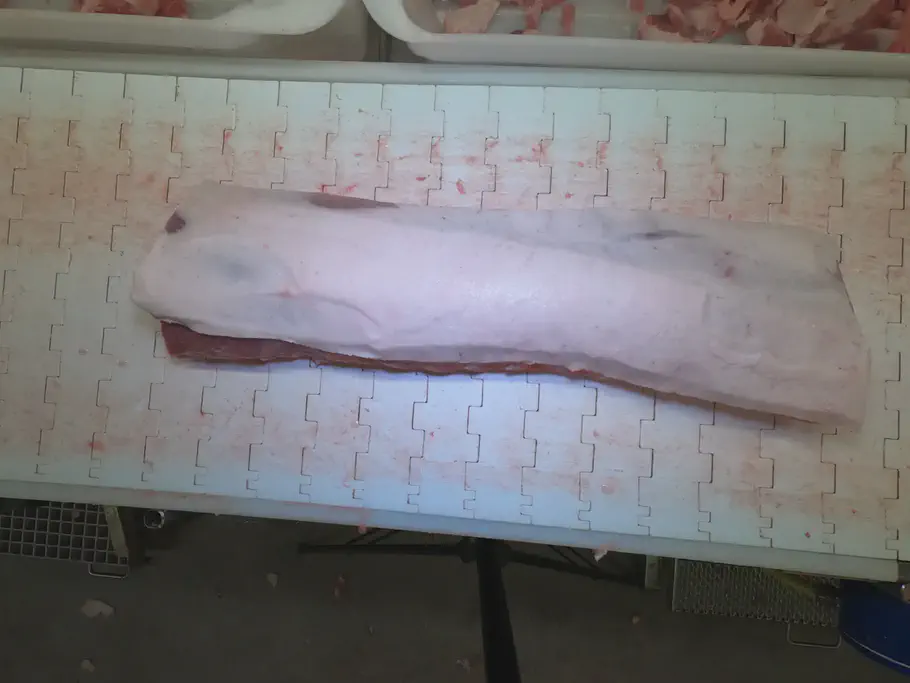
Danish Crown aims to automate the quality control process for their roast pork in order to guarantee the highest quality of the products sent to customers.
This initiative not only enhances customer satisfaction but also considerably minimizes food wastage, thus addressing the issue of food waste.
This objective aligns with Danish Crown’s “Feeding the Future” stratergy, which focuses on reducing the environmental impact of meat production and consumption.
Company Facts
Danish Crown is owned by farmers, and dates all the way back to 1885, when farmers in Horsens gathered and founded Denmark's first pork slaughterhouse.However, it was not until 1990 that the group was named Danish Crown. In 2021, Danish Crown employed approx. 26,000 employees and slaughtered 18.9 million pigs and sows. The turnover in the same financial year was approx. DKK 58 billion
Summary
The Project
Through an extended AI Camp Neurospace and Danish Crown have collaborated to collect vision data of roast pork in production.
A thorough investigation was conducted to explore the potential of computer vision and machine learning in automating the quality control process of roast pork for Danish Crown.

Butcher at the roast pork line (Danish Crown)
In a collaboration between Danish Crown Sæby and our datanauts, photographs were captured one morning along both a roast pork production line and a secondary line. To ensure uninterrupted production, the data collection process was carefully planned to avoid interfering with the butchers working on the line. The data was collected using an inexpensive hobby camera equipped with a filter and appropriate lighting. Given that 450 roast porks pass through a single line within an hour, it was possible to get 700 pictures in a very short time.
Once the raw images were pre-processed by our datanauts, they were reviewed and scored by two highly experienced butchers to assess their visible quality. To minimize the potential for human bias, the task was assigned to two employees. The quality was assessed on a scale from 1 to 5, where 1 is the lowest and 5 is the highest quality. The criteria for defining the quality classes across this scale were meticulously crafted by the experts at Danish Crown specializing in visual / inspection quality.
Approximately 51% of the roasted porks were categorized into the exact same quality class by both experts. About 40% of the roasted porks received a classification that differed by one class. For instance, one employee might assign a class 5 rating while the other assigned a class 4 rating. 2.65% of the roasted porks, received completely opposing assessments on the quality scale. In these cases, one expert rated the visible quality as 1 while the other expert rated it as 5.
This observation confirms the subjectivity of quality assessment, as different individuals may prioritize different factors.
One employee evaluated roasted pork with presence of visual blood on the roasted pork as the lowest quality, whereas the other employee did not assign the same importance to this factor.
Additionally, it was acknowledged that in a Pilot Project, the definitions of the different quality classes should be more precise and distinctly differentiate from one another.
To generate a Proof-of-Technology, our datanauts narrowed down the dataset to include only those roasted porks that received the same quality classification from both Danish Crown Sæby’s experts. This reduction resulted in a substantial decrease in the dataset, from 717 images to 367 unique images of roasted porks.
5 Classes
Although 367, even 700, images are defined as a very small data set for computer vision, it is considered enough by our ML datanauts to prove the potential in this specific case.
The quality of roasted porks is generally high at Danish Crown.
This therefore means that classes 4 and 5 are over-represented in the data set, while classes 1 and 2 are significantly under-represented in the data set (See below).
| Class | Number of Roasted Porks | Proportion % |
|---|---|---|
| 1 | 8 | 2.18% |
| 2 | 47 | 12.81% |
| 3 | 51 | 13.90% |
| 4 | 104 | 28.34% |
| 5 | 157 | 42.78% |
Therefore, it was possible to create a machine learning model which, against their 51% accuracy, had a test accuracy of 58.5% on the images of comb roasts.
Furthermore, the model guesses 35.37% of roasted porks incorrectly with a single class.
That is, a class 5 is assessed to be class 4 or vice versa.
Only 6.12% of the roasted porks are rated 2 classes apart, and no roasted porks are rated 3 or 4 classes from what Danish Crown Sæby’s experts have agreed on.
On such a small data set, with significant under-representation of poor quality rib roasts, this is a success, proving that with more images and better labelling, it is possible to qualify the quality in a category from 1-5.
Simplified Problem
Since 58.5% accuracy does not sound like much, and there are proven challenges in labeling the images in the defined 5 quality categories, we have created a model in which we have simplified the problem.
Former quality categories 1-3 have been transformed into the label low quality, while 4-5 have been transformed into the label: high quality.
The simplification offers several advantages:
- Increased Class Balance: By combining categories, the dataset now exhibits a more balanced distribution, with approximately 28.9% representing low quality and 71.1% representing high quality.
- Reduced Human Bias: The simplified model helps minimize the likelihood of human bias affecting the dataset, as the distinction between quality levels is less granular.
With this simplified approach, the model achieves a test accuracy of 84%. When further investigating the false positives and false negatives, we can see that the model’s predictions are very insecure. It has for instance mistakenly judged a low quality roasted comb to be high quality, but if we look at its probability calculation, we find that the model is 58.68% confident in classifying the roasted pork as high quality and 41.32% confident in its classification as low quality. For true positives and true negatives, the model is much more confident.
Customer Value
- Quality is subjective and difficult to define
- Dividing quality groups into classes 1-5 is not necessarily the right distribution
- It can be advantageous to make the problem binary first and develop further on the project when more data and experience have been collected
- Low-budget hardware is good enough to solve Computer Vision cases
- It is possible to automate the quality control with Computer Vision

